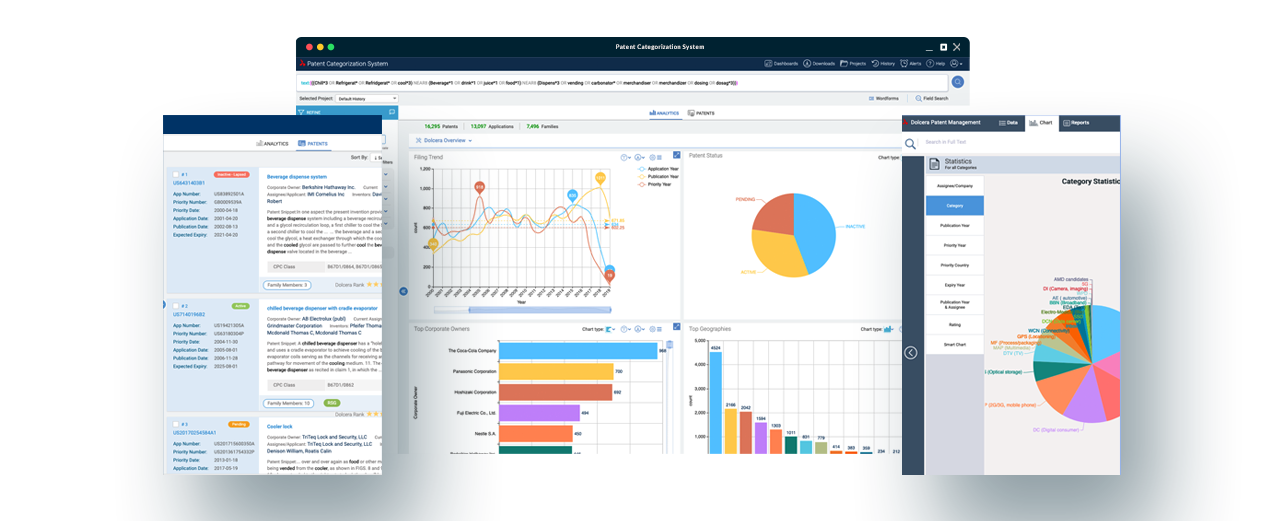
CES 2012: Innovations in Communications Technologies

CES 2012 is just few days away and as always even this year some never heard before innovations will be unveiled at Las Vegas from 12-14th Jan. In this article we are throwing lights on exciting products in communications field that we might see at CES 2012.

Local area connectivity:

Wireless local area networks were confined to speed of 1Gbps as of now. But come CES 2012 and you will find implementations of 802.11ac by Buffalo, Broadcom and Redpipe which can offer data transfer speeds of 4Gbps. If 4Gbps is not enough for you then you might wanna have a look at Wilocity’s display of 802.11ad implementation which pushes data transfer speeds to 7Gbps.

These were the products which enhanced the underlying technology. Now let’s have a look at products which are using existing local area connectivity technologies in newer innovative way. Samsung’s Dual View Camera can send photos over wi-fi so no need to worry about memory getting full. Taztag is coming up with Tazpad which they claim is first NFC tablet in the market. Wohoo fitness has comeup with BlueHR product which when strapped on waist can monitor your heartbeats and send it over blueotooth to your iPhone and some other supported smartphones.

Apart from this Wi3 has come up with WiPNET which can convert traditional coax cable communications to Ethernet/WiFi based digital communication

Also NXP has planned some NFC demos where in use of NXP NFC chips for MCU and automotive applications will be displayed.

Our Favorite: Wilocity’s 802.11ad implementation

Sector Focus: Higher Speeds

Wide Area Connectivity:

4G LTE based handset was introduced in CES 2011. This year WAC has gone one step ahead and Wilson Electronics has come up with Signal Booster for 4G LTE. Novatel wireless has developed MiFi which sets up mobile hotspots to which 4-5 devices can be connected. Pegastick has combined 4G 3G nd 2G i.e. EDGE, HSPA+ and LTE respectively on one USB datacard.OnStar is displaying prototype where in 4G LTE technology is optimized for use in automobiles.

Microsoft, Nokia, Samsung and HTC are expected to launch 4G LTE supporting headsets.

Our Favorite: Pegastick

Sector Focus: Integration and enhancement

pegastick.JPG

Cloud Based Services

Cloud based services seems like a theme of CES 2012, with number of conferences on cloud based services and many other products implementing it. Lenovo is gonna display functioning of its new cloud based storage system while Oplink Communications has come up with C4MI (Cloud for Mobile Interactive) which will allow sensors to access cloud enabling them to process outputs. Fordela has developed a platform for stream multimedia content over the cloud to any device. One outstanding innovation has come from Sanyo, product is called HyperDriveCloudFTP. When USB drive is connected to CloudFTP, drive can act as a wireless file server.

Our Favorite: CloudFTP

Sector Focus: Richer content on cloud

cloud-ftp.JPG

Written by:

Premraj Narkhede

Premraj is a Senior Business Research Analyst at Dolcera with expertise in communications and emerging technologies

[Post to Twitter] Tweet  [Post to Delicious] Delicious  [Post to Digg] Digg  [Post to Facebook] Facebook 

How much money does Universal Display Corporation really make?

Universal Display Corporation announced its financial results for the third quarter of 2011 in the past week. This is the first release of financial information that Universal Display Corporation has made since it signed a new agreement with Samsung Mobile Display. Dolcera presents an analysis of the announcement and the events surrounding it.

Universal Display Corporation reports its revenues in two segments: commercial revenue and developmental revenue. Commercial revenue relates to the incorporation of the company’s OLED technologies and materials into its customers’ commercial products, and includes commercial chemical revenue, royalty and license revenues, and commercialization assistance revenue. Developmental revenue related to OLED technology and material development and evaluation activities for which the company is paid, and includes contract research revenue, development chemicalrevenue and technology development revenue. Here, we mainly look at the commercial revenue of Universal Display Corporation.

Commercial revenue is reported in three parts: commercial chemical revenue, royalty revenue and license fees. In the results of third quarter of 2011, the revenue from royalty and license fees have been reported together. Unfortunately, since the past two years, Universal Display Corporation has been reporting only the change in revenues in each of these categories instead of the actual revenue figures. Some financial results announcements in the past have failed to provide quarterly information at all, instead providing information for the past 9 months or the past year as a whole.

Using historical financial results, we have reconstructed the commercial revenue earned by Universal Display Corporation in the three categories. The following table shows the quarterly commercial revenue by category in the past 5 years:

Quarter

Total
Commercial Revenue

Commercial
Chemical Revenue

Royalty
Revenue

License
Fees

Q1 ‘07

$1,440,900

$1,313,000

$0

$127,900

Q2 ‘07

$392,926

$229,631

$31,395

$131,900

Q3 ‘07

$1,368,201

$1,185,050

$16,051

$167,100

Q4 ‘07

$1,226,021

$871,996

$13,871

$340,154

Q1 ‘08

$1,555,065

$985,560

$267,565

$301,940

Q2 ‘08

$1,395,487

$938,330

$176,447

$228,570

Q3 ‘08

$1,324,924

$1,025,000

$148,261

$151,663

Q4 ‘08

$1,355,282

$803,000

$204,565

$232,959

Q1 ‘09

$1,369,137

$686,165

$278,179

$237,895

Q2 ‘09

$1,239,056

$569,600

$257,959

$244,600

Q3 ‘09

$1,621,416

$808,200

$401,718

$244,600

Q4 ‘09

$1,888,490

$705,900

$623,699

$367,676

Q1 ‘10

$1,830,147

$728,400

$565,877

$344,655

Q2 ‘10

$1,951,892

$841,170

$591,523

$327,984

Q3 ‘10

$2,836,587

$1,642,600

$810,017

$244,600

Q4 ‘10

$4,511,121

$2,527,500

$1,503,647

$177,532

Q1 ‘11

$4,744,075

$1,864,485

$1,796,705

$871,965

Q2 ‘11

$5,278,704

$2,402,130

$1,753,685

$911,970

Q3′11

$9,881,553

$5,107,213

$4,615,245

Source: Company filings

As expected, the revenues have shown a huge jump in the last quarter. Much of this can be attributed to the new agreement between Universal Display Corporation and Samsung Mobile Display. This agreement runs till 2017.  For the first time, Universal Display Corporation has explicitly mentioned the exact revenue it has received from Samsung Mobile Display from license fees. The company has received $3,246,315 from Samsung Mobile Display under its license agreement so far.

Apart from licensing fees, the agreement also increases the commercial chemical sales of Universal Display Corporation. Under the 2005 agreement, the company was the supplier of red PHOLED materials to Samsung Display Corporation. With the August 2011 agreement, Universal Display Corporation now supplies both red and green PHOLED materials to Samsung Display Corporation. Prior to August, Samsung Display Corporation sourced green PHOLED materials from Duksan, a Korea based company. There are no competing manufacturers of red and green PHOLED materials. The new agreement effectively doubles the per unit chemical sales of Universal Display Corporation.

In the following section we calculate the revenue that Universal Display Corporation receives from each display unit sold. All calculations have been performed using publically available data.

In the third quarter of 2010, 413.20 million mobile phone display units were shipped amounting to total revenue of $ 3,380 million. AMOLED display panels had a revenue share of 10.7% of the mobile display market. This results in the AMOLED mobile display panel revenue to be $ 361.66 million. The volume of AMOLED displays was 13.5 million units. In the AMOLED display market, Samsung Mobile Display had a market share of 98.3%. Thus, Samsung Mobile Display sold 13.27 million AMOLED display units and revenue from AMOLED displays units was $ 355.51 million. (Source: DisplaySearch)

Universal Display Corporation announces in all its filings that Samsung Mobile Display is the chief source for all of its commercial revenue. We consider that Samsung Mobile Display is solely responsible for all of Universal Display Corporation’s commercial revenue. The assumption is reasonable given that the period under study is the third quarter of 2010 when Samsung Mobile Display was the only major customer of Universal Display Corporation.

Universal Display Corporation’s royalty revenue for the fourth quarter of 2010 was $ 1,503,647 million. The royalty revenue is considered from the fourth quarter as royalty is paid by Samsung Mobile Display for goods sold in the previous quarter. As calculated earlier, Samsung Mobile Display’s third quarter 2010 revenue from sale of AMOLED display panels was $ 361.66 million. The royalty rate for the agreement between Universal Display Corporation and Samsung Mobile Display thus works out to be 0.423%.

The total number of AMOLED display units sold by Samsung Mobile Display in the third quarter of 2010 was 13.27 million. The royalty received by Universal Display Corporation for these units was $ 1,503,647 million. Thus, the royalty revenue per unit is $0.1133. The chemical sales revenue of Universal Display Corporation for the third quarter of 2010 was $1,642,600. Thus, the chemical sales revenue per unit is $0.1238. The key assumption in this case that the PHOLED material inventory levels of Samsung Mobile Display did not significantly change during the period.

The total revenue that Universal Display Corporation received from sale of each mobile display unit is $0.2371. It is to be noted that the period considered in this analysis is the third quarter of 2010 which is prior to the signing of the new agreement between Universal Display Corporation and Samsung Mobile Display. The August 2011 agreement doubles the chemical sales revenue per unit of AMOLED display panel sold for Universal Display Corporation. Thus, Universal Display Corporation receives $0.3609 for each AMOLED mobile display sold.

The above scrutiny only covers a part of an exhaustive industry analysis. For a detailed analysis of the subject matter, write to us at: info@dolcera.com

Written by: Kunal Krishna

Kunal is a Senior Business Research Analyst at Dolcera with expertise in cleantech and emerging technologies

[Post to Twitter] Tweet  [Post to Delicious] Delicious  [Post to Digg] Digg  [Post to Facebook] Facebook 

The Great Auto Electrification Race

Electric cars have been around for quite some time but taking forever to become a mainstream way of life. With the increased awareness about global warming, greenhouse gases, and rising gas prices there are stronger and stronger incentives every year for them to become a reality.

The US government, and auto industry have realized the same and thus you see the likes of the Chevy Volt (beautiful car, and love the ad) especially coming with a tax credit of 7.5 K on electric cars pitting them very competitively in the 20-30K range. California, and some other states provide a further subsidy of 5K i.e. 12.5K the government is spending on incentivising every electric car.

Which is great, but US is not the only country which has woken up to the reality. US contributes to about 17% of the greenhouse emissions globally, but China contributes about 24%. The Chinese government has realized the importance of Clean Tech and investing heavily into the same already being the biggest market for Wind Energy, and expected to leapfrog US & Europe in Electric Car penetration.

The electrification race has been compared by many to the space race in the 60s, and if that is true US is losing out. China has 120 domestic car companies compared to US’s 13, and there are 33,200 employees working in Lithium battery industry in China compared to 1,100 in the US. But the most important part is the money the Chinese government is putting behind the industry. US govt has decided to invest 5 Bn USD, but the Chinese government is pumping 17 Bn USD.

China is also being slightly smarter (or cunning) about how it gives the money away, they now have 19,300 USD in subsidies on each electric vehicles. GM has decided to develop cars in China with it’s partner SAIC. This combined with the fact that gasoline is twice as expensive in China than in US explains a lot. China has a lot of coal, and able to produce electricity cheaper. It is not just about a more sustainable option environmentally but also economically.

The catch though is China realizes that it is set to be the biggest Auto market in the world (GM already sells more cars in China than in the US), and that it has a lot of bargaining power in allowing foreign players to play in China. It is asking for technology transfer in one of the three core technologies
1. Electric Motors
2. Complex Electronic Controls
3. Power Storage Devices (whether batteries or fuel cell)
to qualify for the subsidy.

This is the same way China built it’s industries in big industries like Wind Turbines, High Speed Trains, and Water Purification.

It’s not a bad deal for the players also, China is hoping to have 5 Mn electric cars on roads by 2020, assuming that GM can get 15-20% market share i.e. 14.475 Bn USD in licensing for the technology! This is thus a model where those confident on their success would be more than happy to share, while others will prefer to stay out e.g. Nissan

By: Pramath Malik

[Post to Twitter] Tweet  [Post to Delicious] Delicious  [Post to Digg] Digg  [Post to Facebook] Facebook 

Sources of Apple’s Innovation

The Tech world is buzzing in 2011. Apple, Android, and Patents seems to the most recurring themes conversations converge too. Apple is a great success story, and literally becoming the apple of everyone’s eye by becoming one of the most valuable companies in the world, consistently innovating and generating higher and higher revenues. They recently posted one of their best quarters ever.

Many see Apple’s rise as a challenger to the Open Innovation theories, and positing that in technology a closed system offers you much more strength and sustainable innovation coming up with products which have completely re-shaped markets.

Of course Apple had a visionary in the form of Steve Jobs, but technologies don’t just develop “magically” and systems don’t just fall into “amazing” perfect tandem on their own. So, we at Dolcera decided to look into what exactly are the sources of Apple’s innovation.

Apple being a very secretive company, it was hard to find a lot of inside information. But one of the best sources of “innovation” data is the legal document which one gets for innovating - a patents. We decided to look at the patents of Apple and get an idea of the true sources of Apple’s innovation.

In our opinion, the key sources of Apple’s innovation are :
1. Expenditure on research,
2. Acquisitions, and
3. Patent Deals
Apple definitely has a strong in-house research. But every time Steve Jobs wished to make one of his “visions” a reality, it often required Apple to go out and spot “sources” which can be acquired, or taken the technology from. Some prime examples are acquisition of Fingerworks which developed the Multi-Touch for iPhone, and technology licensing from LiquidMetal which gave Apple products their great aesthetics among many others.

We have tried to provide a basic story flow in the visual below.

We are also conducting web seminars to detail on the findings of our research, and how you too can do the same. For details contact us at - info@dolcera.com

Sources of Apple's Innovation

 Author: Pramath Malik

[Post to Twitter] Tweet  [Post to Delicious] Delicious  [Post to Digg] Digg  [Post to Facebook] Facebook 

Broadcom acquires Netlogic

Broadcom plans to acquire chipmaker Netlogic Microsystem, a maker of networking equipment. At USD 50 per share, Broadcom has agreed to invest 3.7 Bn USD in the deal. This is the biggest acquisition by Broadcom hence has many scratching their heads to understand the motivations of Broadcom, and their future plans as Broadcom has agreed to pay a 57% premium over the closing price on September 9th, 69% premium over average trading price for last 20 days.

Strategically, CEO Scott McGregor stated that the deal will double Broadcom’s market in networking equipment, which takes a substantial 23% share of their sales.

Financially it seems to make sense, as Netlogic has higher gross margin (55%) than Broadcom (52%), and the deal is expected to increase EPS (earning per share) by 10 cents as claimed by Broadcom.

Netlogic is known for it’s processors which help transfer multimedia (video), and other data over the internet efficiently. With a surge in consumption of data due to smartphones, and requirements of these has been on a rise.

This in effect is thus one of the three biggest deals caused by “smartphone phenomenon” with the other two being
1. Nortel patent portfolio sale for 4.5 Bn USD
2. Google’s acquisition of Motorola Mobility for 12.5 Bn USD

The exorbitant price tags associated with all of these deals have shocked many. So while Nortel, and MMI had patents being the primary asset, we decided to dig into Netlogic’s patent portfolio.

Patent by Priority year

Patents published every year

Netlogic though not a giant portfolio like Nortel, has been slowly chugging about and innovating in the areas of :
1. Accessing, addressing or allocating withing memory systems or architectures
2. Associative or content-addressed stores
3. Transmission of digital information
4. Methods for processing data
5. Digital computing or data processing equipment for specific functions

Patent Taxonomy for NetLogic

These are closely related to the knowledge-based processors, multi-core embedded processors, and digital front-end processors which Netlogic will bring to Broadcom.

Some of the key patents of Netlogic too are in these areas. The 5 most cited documents of Netlogic are as following :
1. US6154384 - Ternary content addressable memory cell -  119 patent citations
2. US6237061 - Method for longest prefix matching in a content addressable memory - 117 patent citations
3. US6137707 - Method and apparatus for simultaneously performing a plurality of compare operations in content addressable memory device - 105 patent citations
4. US6317350 - Hierarchical depth cascading of content addressable memory devices - 64 patent citations
5. US6240485 - Method and apparatus for implementing a learn instruction in a depth cascaded content addressable memory system - 52 patent citations

Broadcom has 214 patent families in IPC classes G06F 12, and G11C 15. And it gains 106 patent families from Netlogic. These two are the key technology areas in which the patents of NetLogic fall.

But besides the intellectual assets, Broadcom is also gaining the employee, among whom will be prolific inventors :

Key inventors at NetLogic

Given the trend of increasing data consumption, the move makes perfect sense from Broadcom’s perspective. Wether 3.7 Bn USD is a fair price, only time will tell

Author: Pramath Malik

[Post to Twitter] Tweet  [Post to Delicious] Delicious  [Post to Digg] Digg  [Post to Facebook] Facebook 

Carbon nanotubes patent landscape and market research report

Wireless Sensor Networks - A Market Research Report

Introduction:

Wireless sensor network (WSN) is a wireless network consisting of spatially distributed autonomous devices using sensors to cooperatively monitor physical or environmental conditions, such as temperature, sound, vibration, pressure, motion or pollutants, at different locations.

Wireless Sensor Networks

Unique characteristics of a WSN include:

  •     Limited power they can harvest or store
  •     Ability to withstand harsh environmental conditions
  •     Ability to cope with node failures
  •     Mobility of nodes
  •     Dynamic network topology
  •     Communication failures
  •     Heterogeneity of nodes
  •     Large scale of deployment
  •     Unattended operation

Efficient power management

Several techniques are used for efficient power management

  • Dynamic power management (DPM): Dynamic power management (DPM) is an effective tool in reducing system power consumption without significantly degrading performance. The basic idea is to shut down devices when not needed and wake them up when necessary.
  • Data-Driven Power Management (DDPM): A new power management framework called Data-Driven Power Management (DDPM) is used as the infrastructure for integrating various energy efficient techniques, such as approximate querying and sleep scheduling.
  • Efficient Sleep Scheduling based on Application Timing (ESSAT): Another technique Efficient Sleep Scheduling based on Application Timing (ESSAT), a novel power management scheme that aggressively exploits the timing semantics of wireless sensor network applications. ESSAT protocols have several distinguishing features. First, they can save significant energy with minimal delay penalties. Second, they do not maintain TDMA schedules or communication backbones; as such, they are highly efficient and suitable for resource constrained sensor platforms.

Low power operation on batteries :

Networks of sensors are widely used for monitoring and control applications. In a communication network, deployment of wires is expensive and causes hassles during normal operations and maintenance. This led to the development of wireless networks. Wireless sensor networks not only eliminate the need for wires, but also open many new application domains. Reliability and low-power consumption are the two important factors, which determine the performance of a WSN. Though messages are exchanged without any data cables in a WSN, power cables are required for powering sensor devices. Power is fed to the WSN via mains supply. But, this concept is now replaced by batteries and energy harvesting devices. If batteries are used, replacement and maintenance issues cause concern. Power management techniques (low-power/ultralow-power WSNs) seem to be the viable solutions in improving the lifetime of the batteries and various low-power technologies are being developed in this spectrum. Power/energy harvesting is an emerging technology, which eliminates the need for batteries.

Energy Harvesting technologies :

Energy harvesting technologies are required for autonomous sensor networks for which using a power source from a fixed utility or manual battery recharging is infeasible. An energy harvesting device (e.g., a solar cell) converts different forms of environmental energy into electricity to be supplied to a sensor node. However, since it can produce energy only at a limited rate, energy saving mechanisms play an important role to reduce energy consumption in a sensor node.
Energy harvesting technologies such as piezoelectric, thermoelectric and others will have potential applications in wireless sensor networks and low-power devices.

Products:

The Wireless sensor networks have Microcontroller kits which controls all motes in the network and especially for low power harvesting in the network we have different kind of batteries and energy harvesting and converting modules like thermal energy harvesters and solar energy harvesters

Market research:

World Market projection:

*Wireless Sensors and Transmitters market is growing worldwide. The below figures indicates there is a drastic change in last few years and these number increases in future.

*Last 5 Years: Market growth is huge in the last 5 years increased from 180 million dollars in 2005 to 380 million dollars approximately (200 % growth).

*Future: Market forecasts reaches to 1800 million dollars by 2012 approximately (45% growth)

Revenue Market Forecasts (World), 2002-2012

Global Market projection:

*The below graph shows wireless sensors and Transmitters market in different regions North America, Europe, Asia pacific, and other countries of world.

*Major market growth in North America, Europe and Asia Pacific.

*Last 5 Years: In North America the market increased from 20 million dollars to 160 million dollars approximately, in Europe the market increased from 15 million dollars to 130 million dollars approximately, in Asia-Pacific the market increased from 8 million dollars to 120 million dollars approximately.

*Future: Market forecast reaches to 600 million dollars in North America, 500 million dollars in Europe and 400 million dollars in Asia pacific approximately.

Revenue Forecasts by Geographic Region (World), 2002-2012Contributing Authors

Rajeshwari, Haritha, Garg and Sateesh

[Post to Twitter] Tweet  [Post to Delicious] Delicious  [Post to Digg] Digg  [Post to Facebook] Facebook 

Tweet links powered by Tweet This v1.4.1, a WordPress plugin for Twitter.